Back from your holidays? Your tan starts to fade away, but the memories stay. Well yes, it’s time for the return from school holiday with its gloominess… But it is also time for the inflight summer report! Let’s go back to the travel trends of our travelers in numbers.

Summer 2018 inflight report
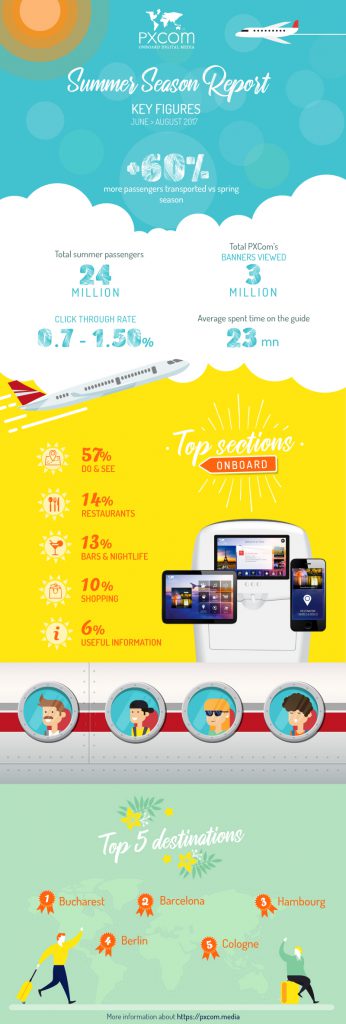
This year, 24 million passengers were transported by our airline network, with almost 3 million advertising banners impressions onboard. In average, travelers read our digital guides for 31 minutes for a 0.7 to 1.5% click rate. Among all our customers, Visit Arona is the biggest winner with 6000 points of interest in its inflight marketing campaign.
What were the most viewed sections on our digital travel guides?
Onboard travelers have, right at this moment, free time and attention to give. They are active on the screens in front of them, as much as on their tablets or smartphones. This is the perfect moment where your brand and offers promotion will be the most efficient and impactful. Unsurprisingly, the tourist activities at destination are the most viewed (57%), followed by restaurants (14%) and bars (13%).
Which destinations generate the most interactions with travelers?
Barcelona, Bucharest and Hamburg have been our travelers’ favorite destinations this year to read our digital guides.
Also want to promote your business onboard of the largest airlines? Discover everything about inflight advertising and how to promote your brand thanks to the Webrooming concept.


